
Client Letter | 3Q 2023 Recap & 4Q 2023 Outlook
Key Updates on the Economy & Markets
Stocks and bonds were both impacted by a chain of events during the third quarter. It started with rising oil prices, which caused inflation to re-accelerate in August. The rebound in inflation contributed to a sharp rise in interest rates, with the 10-year Treasury yield rising above 4.50%. The rise in interest rates pressured stock market valuations, and the S&P 500 finished the third quarter with a -3.2% return. This letter recaps the third quarter, discusses the rise in oil prices and interest rates, and looks ahead to the fourth quarter of 2023.
Rising Oil Prices Reignite Inflation Fears
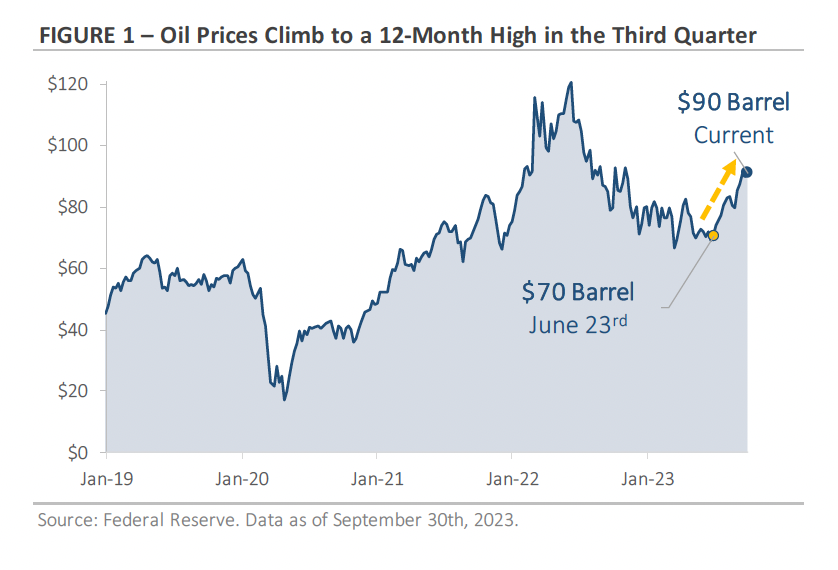
After trading lower during the past year, oil prices rose to a 12-month high during the third quarter. Figure 1 shows oil ended September above $90 per barrel after starting the quarter near $70. The steady climb in oil prices was attributed to a continued mismatch between demand and supply. Oil demand remains strong as the global economy continues to grow, while OPEC recently agreed to extend its production cuts through the end of 2023. Additionally, the US’s Strategic Petroleum Reserve sits at its lowest level since the 1980s, which leaves little capacity to mitigate potential supply disruptions. With OPEC’s production cuts squeezing global supply, oil prices surged nearly 30% in the third quarter.
The rise in oil prices caused inflation to re-accelerate in August, with gasoline prices accounting for over half of the monthly increase. While the rebound in inflation was widely expected, it focused attention back on the threat of persistent inflation. Oil’s use as a transportation fuel means that it touches nearly every aspect of the economy, and a continued rise in oil prices could keep upward pressure on inflation as rising fuel costs are passed through to the end consumer. Inflation pressures have declined significantly during the past year, but as the recent rise in oil prices shows, the risk of inflation flare-ups remains high.
Treasury Yields Rise Sharply in the Third Quarter
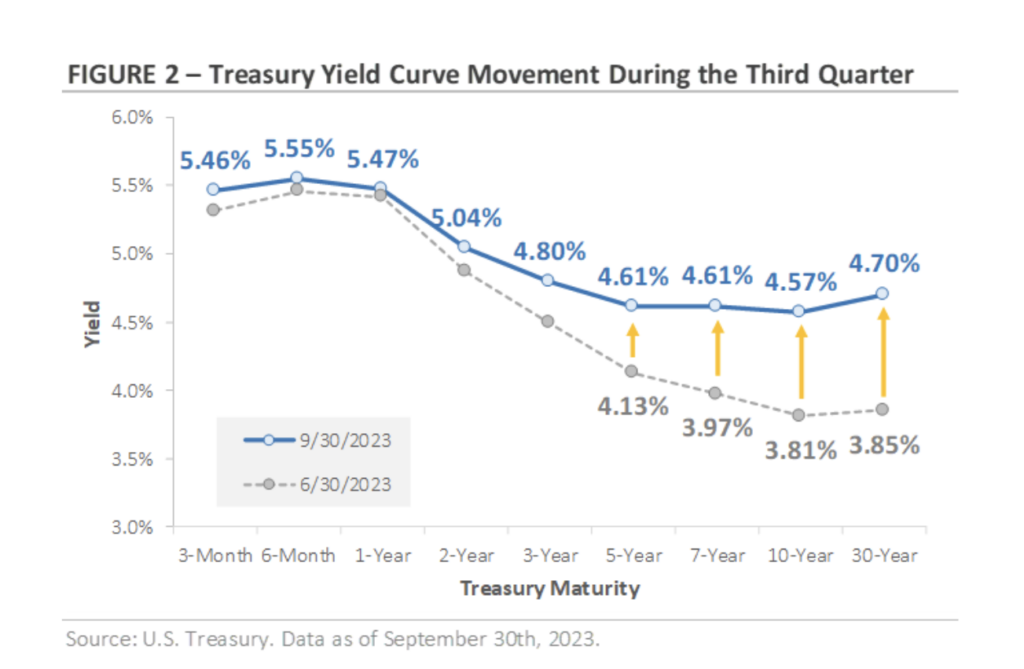
The prospect of renewed inflation contributed to the rise in interest rates during the third quarter. Figure 2 graphs the change in various Treasury yields from June 30th to September 30th. On the left side of the chart, the yields for maturities of two years or less were relatively stable. These short-term yields are highly sensitive to Federal Reserve policy, and the Fed’s only action was a 0.25% interest rate hike at the July meeting. Moving to the right, you’ll notice a sizable increase in yields on longer-maturity Treasury bonds. The 7-year yield rose 0.64% during the quarter, while the 10-year and 30-year yields both rose by more than 0.75%. The sharp rise in yields was a big development during the quarter. Excluding the pandemic, the last two times the 10-year yield rose by over 0.75% in a 3-month period were in 2013 and 2016.
What led to the rapid rise in Treasury yields? One contributing factor was the surge in oil prices and subsequent increase in inflation. Throughout the first half of 2023, investors believed that falling inflation would result in fewer interest rate hikes by the Fed and potentially quicker interest rate cuts. However, with the economy remaining stronger than expected and oil prices rising, there is a growing realization that the Fed may need to keep interest rates higher for longer to prevent inflation from becoming entrenched. The recent rise in yields indicates the market is preparing for a longer period of higher interest rates and fewer near-term rate cuts. Another contributing factor was the increased issuance of Treasury bonds. Following the debt ceiling resolution in May, the Treasury Department can now issue more bonds to fund the growing U.S. government deficit. Treasury bond issuance is forecast to increase in the coming quarters, and investors are concerned that the surge in supply will outpace investor demand and cause bond prices to decline.
Consumers Face Higher Borrowing Costs
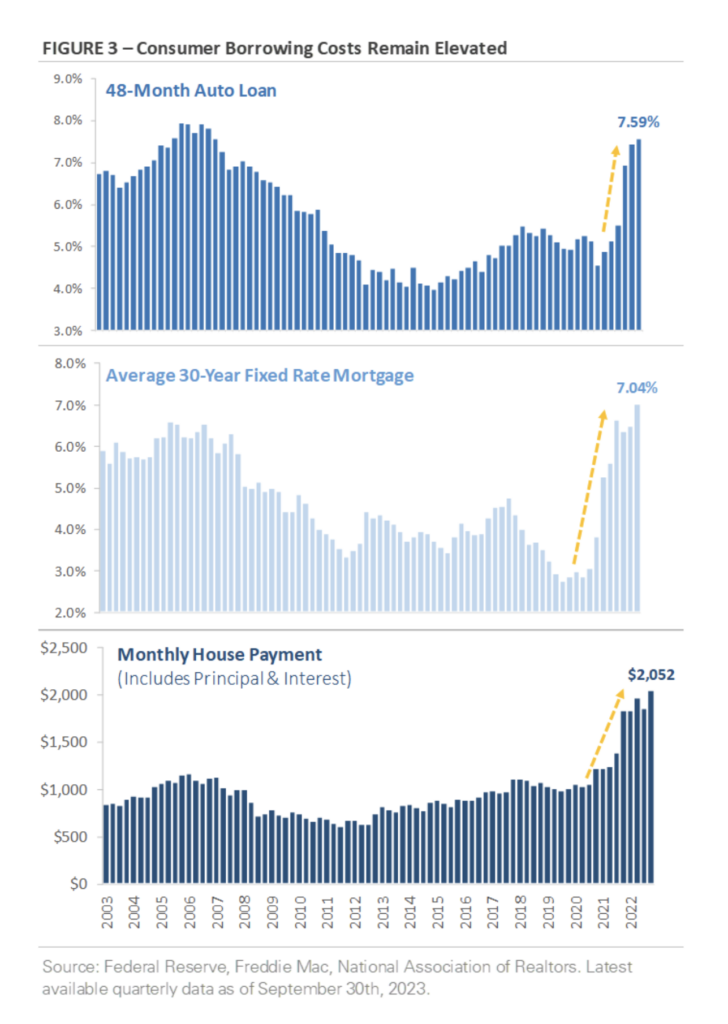
The stacked charts in Figure 3 show the Fed’s series of interest rate hikes have led to a sharp rise in borrowing costs. The top chart shows the interest rate on a 48-month auto loan has risen from 4.6% at the end of 2021 to 7.6% at the end of June. The middle chart shows the average 30-year fixed-rate mortgage rose from 3.8% to 7% over the same period. The recent rise in Treasury yields pushed mortgage rates above 7.30% during the third quarter, which implies that interest rates on auto loans also increased over the past few months.
The bottom chart illustrates how the rise in mortgage rates has impacted the homebuying process. According to the National Association of Realtors, the monthly house payment has risen from $1,249 at the end of 2021 to $2,052 at the end of June. Factoring in the rise in mortgage rates during the third quarter, the current monthly house payment is likely even higher. While many homeowners locked in low mortgage rates during the past few years, today’s homebuyers are navigating a combination of higher mortgage rates and home prices that are still elevated.
It’s not just homebuyers and consumers who face higher borrowing costs. Borrowers of all types, including businesses and commercial real estate owners, are adjusting to a new world with higher interest rates. For some borrowers, the math of higher monthly payments doesn’t work like it used to when interest rates were lower during the past decade. The looming question is whether borrowers can manage the increased interest rates and maintain their payments.
Data already indicates consumers, businesses, and commercial property owners are feeling the stress of higher rates. The percentage of auto loan delinquencies, which is defined as loans 90 days or more overdue, is rising across every age group, and there is a similar trend in credit card delinquencies. The rising number of Chapter 11 bankruptcy filings suggests businesses are also feeling the effect of higher rates, while some commercial real estate owners have made the strategic decision to hand keys over to lenders rather than invest more money in undesirable buildings. These early signs of stress suggest lenders and investors should be mindful of potentially above-average credit risk in the coming years.
Equity Market Recap – S&P 500 Ends the Third Quarter with a Slight Loss
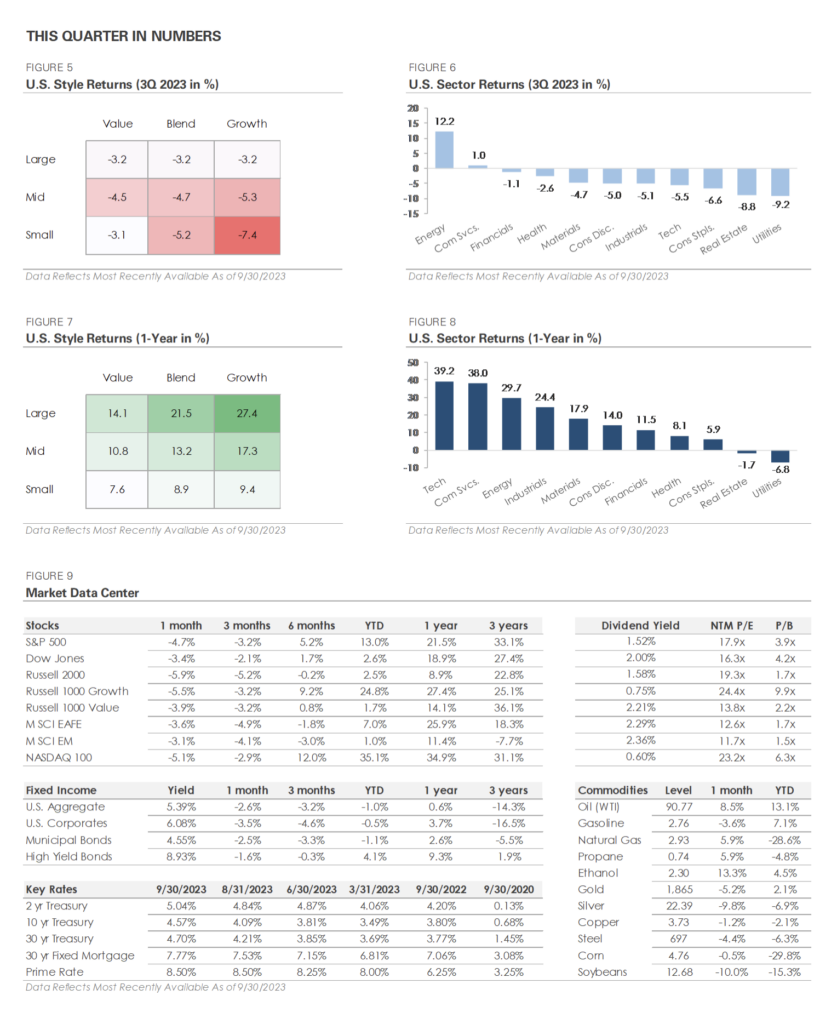
Stocks traded down slightly in the third quarter, with most of the losses occurring in August and September as rising interest rates weighed on equity market valuations. The S&P 500 ended the third quarter with a -3.2% return, while the Russell 2000 Index of small cap companies returned -5.2%. The Nasdaq 100, which tracks growth stocks, returned -2.9%. Despite negative returns during the quarter, the major stock indices have still posted strong gains this year. The S&P 500 has returned 13% through the end of September, while the Nasdaq 100 has gained 35.1% this year after trading lower in 2022.
Moving down to the sector level, Energy was the top-performing sector as oil prices climbed nearly 30%. Communication Services was the only other sector to trade higher, while the remaining nine sectors posted single-digit losses. Defensive sectors underperformed as rising interest rates weighed on the Utility, Real Estate, and Consumer Staple sectors.
International stocks underperformed U.S. stocks during the third quarter as rising Treasury yields caused the U.S. dollar to strengthen. The MSCI EAFE Index of developed market stocks returned -4.9%, while the MSCI Emerging Market Index returned -4.1%. Year-to-date, international markets have underperformed U.S. stocks due to their lower exposure to both growth-oriented stocks and the emerging artificial intelligence industry.
Credit Market Recap – Bonds Trade Lower as Interest Rates Rise
Rising interest rates were a significant headwind for bonds during the third quarter. Figure 4, which graphs the quarterly total return of the Bloomberg Bond Aggregate Index, puts the losses in perspective. The chart shows the Bond Aggregate Index, which tracks a wide array of Treasury, corporate, and municipal bonds, generated a total return of -3.2% during the third quarter. The negative total return indicates the decline in bond prices more than offset the interest received during the quarter.
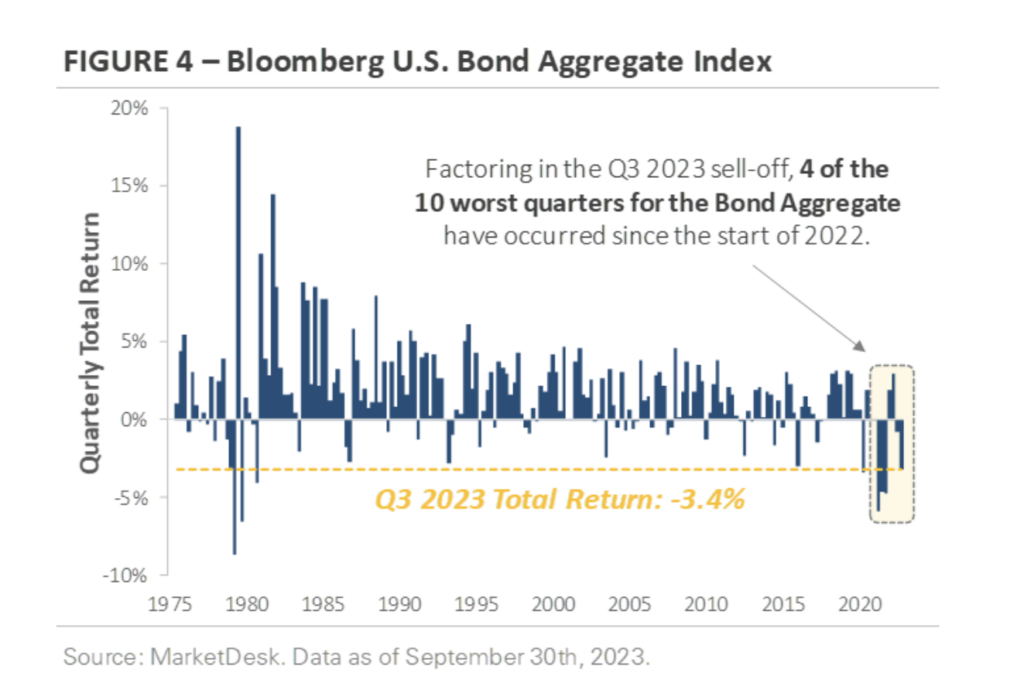
The yellow line in Figure 4 shows bonds haven’t experienced a sequence of negative returns like the current trend since the 1970s, which was the last time the Fed aggressively raised interest rates to combat inflation. Factoring in the third quarter sell-off, four of the 10 worst quarters for the Bond Aggregate Index have occurred since the start of 2022. While savers are earning significantly more interest compared to the last decade, the higher interest income is being offset by falling bond prices.
Elsewhere across the bond market, riskier bonds continued to outperform higher-quality bonds during the third quarter. High-yield corporate bonds produced a total return of -0.3%, while investment-grade corporate bonds generated a -4.6% total return. The performance gap can be attributed to two factors. First, high-yield bonds typically have shorter maturities than investment-grade bonds. As a result, rising interest rates had less of an impact on high-yield bonds during the third quarter. Second, high-yield bonds offer a higher yield than investment-grade bonds to compensate for their increased credit risk. This higher yield boosted high-yield’s total return and offset a portion of capital losses.
Fourth Quarter Outlook – What to Watch?
After a challenging 2022, it’s been a good year for investors. Entering the fourth quarter, the S&P 500’s year-to-date return has already surpassed the average return for a full calendar year.
Several factors will influence how the market finishes this year, including the paths of oil prices and interest rates. Corporate earnings and economic data will also be at the top of many investors’ watchlists. The third-quarter earnings season starts in mid-October, and it will provide key insights into consumer spending and the impact of higher interest rates. On the economic front, investors will be focused on the labor market, the trajectory of inflation, and third-quarter GDP growth, which will be released in late October.
Our team will be tracking corporate earnings and economic trends throughout the fourth quarter to help guide portfolio positioning. The market is entering the final stretch of 2023, but there are still a lot of important data points to be released and questions to be answered before we turn the calendar to 2024.
Important Disclosures: This information is for informational purposes only and should not be construed as investment advice. Investors should consult with their investment advisor to determine the appropriate investment strategy for their individual situation. See ifrahfinancial.com/disclosures for additional information and disclosures.