
Client Letter | 2Q 2023 Recap & 3Q 2023 Outlook
Financial Markets Rebound in the First Half of 2023
A year can make a big difference. One year ago, the market was trying to catch its breath after a chaotic start to 2022. The Federal Reserve had raised interest rates by 1.5% in a little over three months. Inflation touched 9% as Russia’s invasion of Ukraine upended commodity markets and competition for employees resulted in wage inflation. The S&P 500’s first half 2022 return was its worst start to a calendar year since 1970. Fast forward 12 months, and the backdrop is markedly different. Oil prices are -33% lower, inflation is running at a 4.1% pace, and the S&P 500 is up +16.7% this year. This letter reviews the second quarter, recaps the strong start to 2023, and discusses the outlook for the second half of the year.
Data Highlights U.S. Economy’s Momentum
While the backdrop has significantly changed, second quarter economic data highlighted the U.S. economy’s continued resilience. In the housing market, new home sales rose more than 10% year-over-year in both April and May as tight inventories pushed homebuyers to the new construction market. Personal income, which measures an individual’s total income from wages, investments, and other sources, continued to grow along with wages and interest income. While unemployment rose slightly to 3.7%, companies added ~300,000 jobs in both April and May. Revised data showed the economy expanded at a faster pace in Q1 than previously estimated. First quarter U.S. GDP growth was revised up to a 2% annualized pace from the initial 1.3% estimate, reflecting upward revisions to exports and consumer spending.
The data underscores the economy’s momentum, but it’s backward-looking rather than forward-looking. How much longer can the U.S. sustain its economic strength? An index of leading economic datapoints suggests the U.S. may be near a turning point. Figure 1 compares the year-over-year change in the Leading Economic Index (LEI) against the Coincident Economic Index (CEI). For context, the LEI is an index of ten economic datapoints whose changes tend to precede changes in the overall economy, such as unemployment claims, building permits, and manufacturing hours worked. The CEI is an index of four datapoints that tend to move with the economy and provide an indication of the current state of the economy, such as industrial production and personal income. The gray shades represent past U.S. recessions.
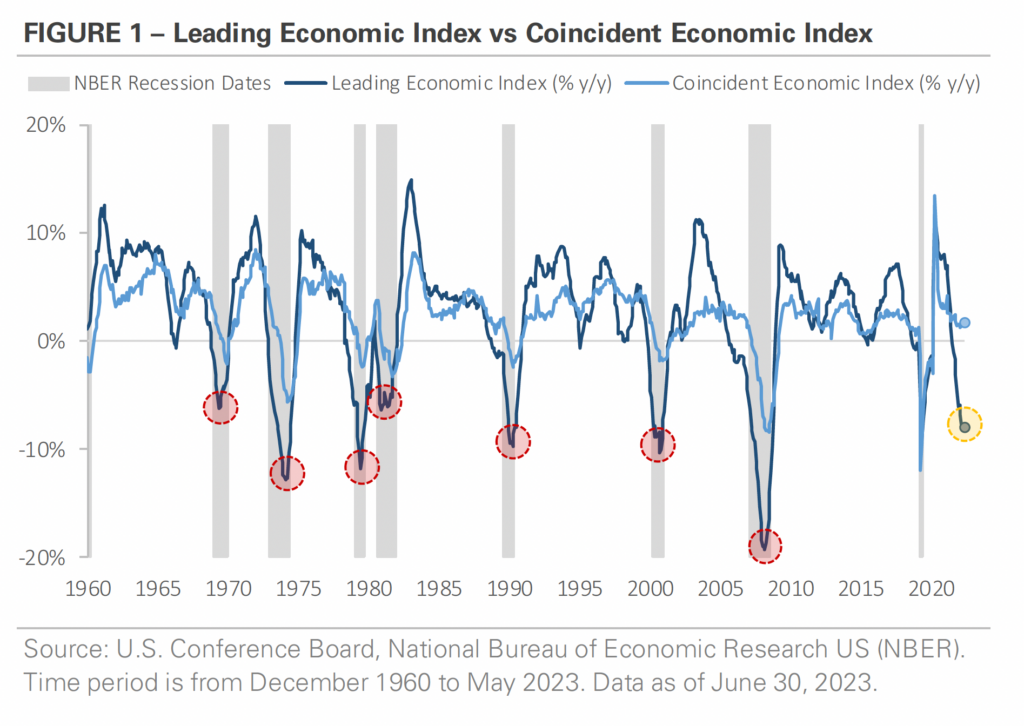
The chart shows the LEI declined -8% during the past 12 months, an indication the economy may be approaching a turning point as the Fed’s interest rate hikes take effect. In contrast, the CEI rose +2% over the same period, an indication the economy currently remains strong. What does the LEI/CEI divergence imply? Positive CEI doesn’t necessarily mean the economy has avoided a recession, but CEI’s rise does provide additional evidence showing the U.S. economy’s resilience despite higher interest rates. On a related note, the chart shows it’s not uncommon for the LEI to decline even as the CEI remains positive. The red circles highlight prior instances like today, where LEI declined first and then CEI declined later. However, the gay shades show the U.S. economy has been near the start of a recession each time the LEI fell by more than -5% in 12 months.
S&P 500 Companies Beat Q1 Earnings Estimates
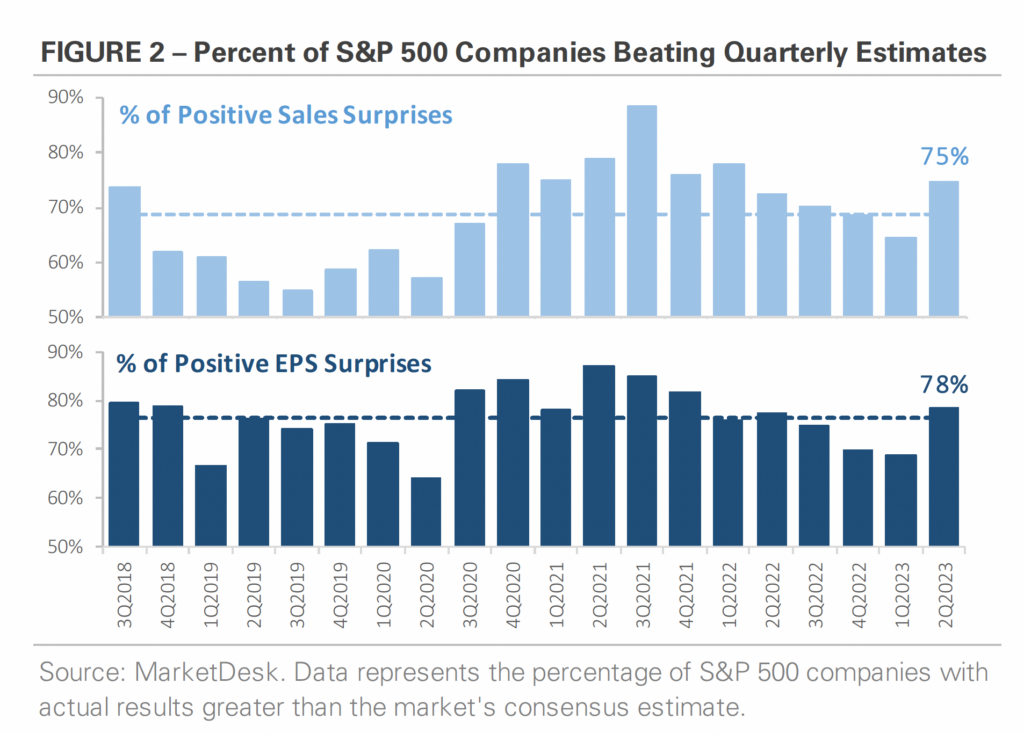
Corporate earnings tell a similar story to economic data. While the S&P 500’s earnings declined -2% year-over-year in the first quarter, an increasing number of companies reported results that exceeded analysts’ estimates. Figure 2 graphs the percentage of S&P 500 companies beating sales and earnings estimates during Q1 earnings season. The top chart shows 75% of companies beat their sales estimate in Q1, up from 65% the prior quarter and above the 5-year average of 69%. From an earnings perspective, 78% of companies beat their estimate, up from 69% the prior quarter and slightly above the 5-year average of 76%. Like the economy, investors appear to be underestimating corporate earnings strength.
A look ahead to Q2 earnings season reveals a dynamic that is similar to the LEI/CEI divergence. The S&P 500’s earnings are forecasted to decline -7.1% year-over-year in Q2 2023. For reference, analysts forecasted a -4.7% earnings decline back on March 31 before Q1 earnings season. It’s not uncommon for analysts to revise earnings estimates during earnings season as they get more up-to-date information from companies. The downward revision indicates analysts remain skeptical about companies’ ability to grow earnings in an environment with higher interest rates and the economy returning to trend after a period of strong growth over the past few years. Like economic data, the question is whether the downbeat earnings forecast or Q1’s better-than-expected actual results is more indicative of the path forward.
An Update on the U.S. Banking System
It’s been four months since the first signs of bank turmoil in early March, and data indicates the stress is easing. Bank deposits plunged in March after steadily declining for almost a year, but data from the Federal Reserve shows deposits stabilized in Q2. On a related note, there were concerns deposit outflows would cause banks to slow, and potentially shrink, their lending activity. However, another Federal Reserve dataset shows loans and leases on bank balance sheets held relatively steady in Q2. While banks are not increasing their lending activity, the data indicates they are not pulling back either.
The data suggests banks are on more stable footing today, but there are still questions about the banking system. Recent stability doesn’t necessarily rule out the risk of deposits continuing to trend lower, especially with interest rates remaining elevated. In addition, profitability is a concern. Why? Broadly speaking, banks make money by charging a higher interest rate on loans than the interest rate they pay on deposits. Now that depositors can earn a higher yield on bonds, banks must pay a higher interest rate on deposits. However, banks’ interest income is still tied to loans made during the past few years when interest rates were lower. An increase in interest expense without an offsetting increase in interest income means banks’ profit margins may decline. In addition, there is concern banks may lose money on consumer, business, and real estate loans if the economy weakens. The pressure on deposits eased in Q2, but banks may not be in the clear yet.
Equity Market Recap – The Rally Broadens Out
Equity markets are off to a strong start this year. After a steep sell-off in the first half of 2022, the S&P 500 returned +16.7% in the first half of 2023. The year-to-date gain ranks as the fifth strongest first half return since 1989. The biggest Technology stocks performed even better, with the Nasdaq 100 returning +15.3% in Q2 after its +20.7% Q1 return. The Nasdaq 100’s +39.1% return is the strongest first half year return since 1989, ranking ahead of both 1998 and 1999 during the dot-com bubble. Small cap stocks also participated in the rally, returning +8.1% through the end of June. The year-to-date equity market gains have lifted portfolios after a difficult 2022.
While the S&P 500’s headline return is impressive, a look underneath the surface tells a different story. Figure 3 compares the performance of the S&P 500 Index against an equal weight version of the S&P 500 Index. Why is this relevant? The S&P 500 Index is weighted by market cap, which means the biggest stocks can significantly impact the index’s headline return. An equal weight index neutralizes the impact of the biggest stocks and allows investors to track how the average stock is performing. The chart shows the two versions of the S&P 500 Index traded together in January and February, an indication market cap didn’t significantly impact performance. he chart shows the two versions of the S&P 500 Index traded together in January and February, an indication market cap didn’t significantly impact performance.
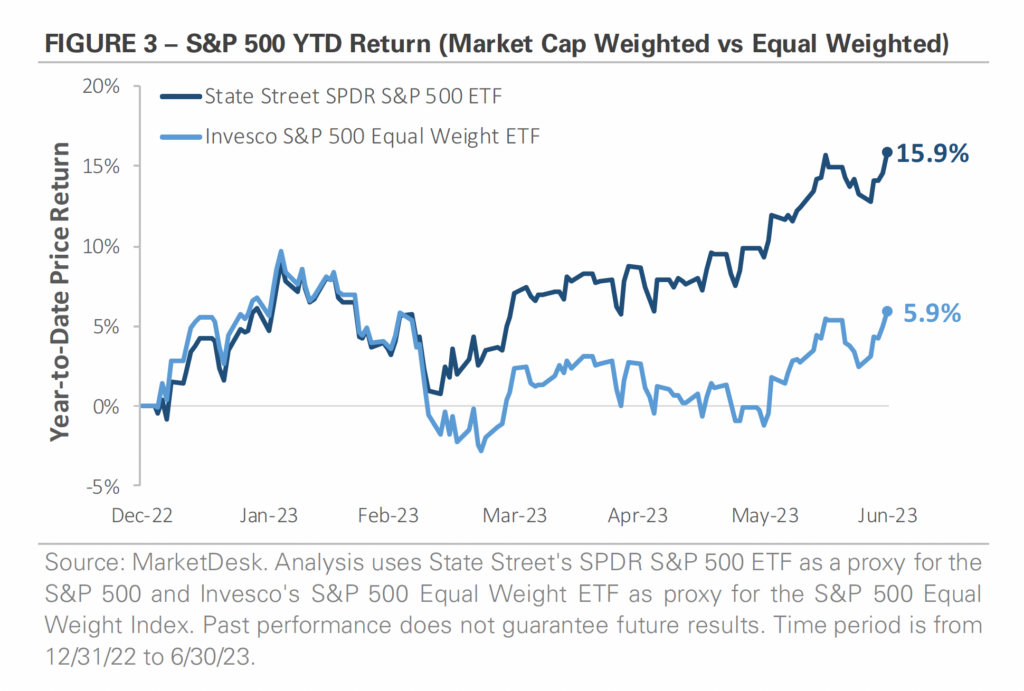
However, the market cap and equal weight versions of the S&P 500 diverged in March when the first signs of regional bank turmoil appeared. The S&P 500 traded higher in April and May, while the Equal Weight S&P 500 traded sideways. The split indicates the biggest stocks drove a large portion of the S&P 500’s gain in Q2. While the S&P 500 ended the first half of 2023 with a strong return, the average stock’s return was noticeably smaller and indicates the first half rally was top-heavy. Investors will be watching to see if the first half S&P 500 rally broadens in the second half of the year.
After outperforming in the first quarter, international stocks underperformed U.S. stocks in the second quarter. The MSCI EAFE Index of developed market stocks gained +3.2%, outperforming the MSCI Emerging Market Index’s +1.0% return but underperforming the S&P 500 by -5.5%. Looking across international markets, Latin America was the top performing international region as both Brazil and Mexico traded higher. Latin America is benefitting from geopolitical tensions between the U.S. and China, which is pushing investment toward the region. Within developed markets, Asia outperformed Europe as Japanese stocks traded to a 30-year high. The catch – Japanese stocks are only now getting back to breakeven after the country’s late-1980s real estate bubble popped and the stock market crashed.
Credit Market Recap – Riskiest Bonds Outperform Due to Higher Yields
Treasury yields rose sharply in Q2 after ending Q1 lower due to regional bank stress. The 2-year Treasury yield, which is viewed as a proxy for Federal Reserve policy rate, rose from 4.06% to 4.87%. Over the same period, the 10-year Treasury yield rose from 3.49% to 3.81%. The increases are being attributed to better-than-expected economic data, which could in turn force the Fed to raise interest rates higher than previously thought. Rising interest rates weighed on bonds in Q2 with the Bloomberg U.S. Bond Aggregate, an index that tracks a wide array of Treasury, corporate, and other investment grade bonds, producing a -0.9% total return.
While rising interest rates caused bonds to trade lower, high yield corporate bonds traded higher in Q2 and produced a +0.7% total return. The top chart in Figure 4 takes the analysis a step further by comparing the return of CCC bonds, which are the lowest rated corporate bonds with a higher perceived risk of default, against a broad index of corporate investment grade bonds. The chart shows CCC-rated bonds generated a ~10% total return through June 30th, which includes both price appreciation and interest received. For comparison, investment grade bonds generated a ~3% total return over the same period. Why are the riskiest corporate bonds outperforming? They offer a higher yield as compensation for taking on more credit risk. An index of corporate investment grade bonds yielded 5.6% on June 30th, while an index of CCC bonds yielded 14.0%, almost 2.5x higher. The higher yield translates into more interest income, helping to boost total return.
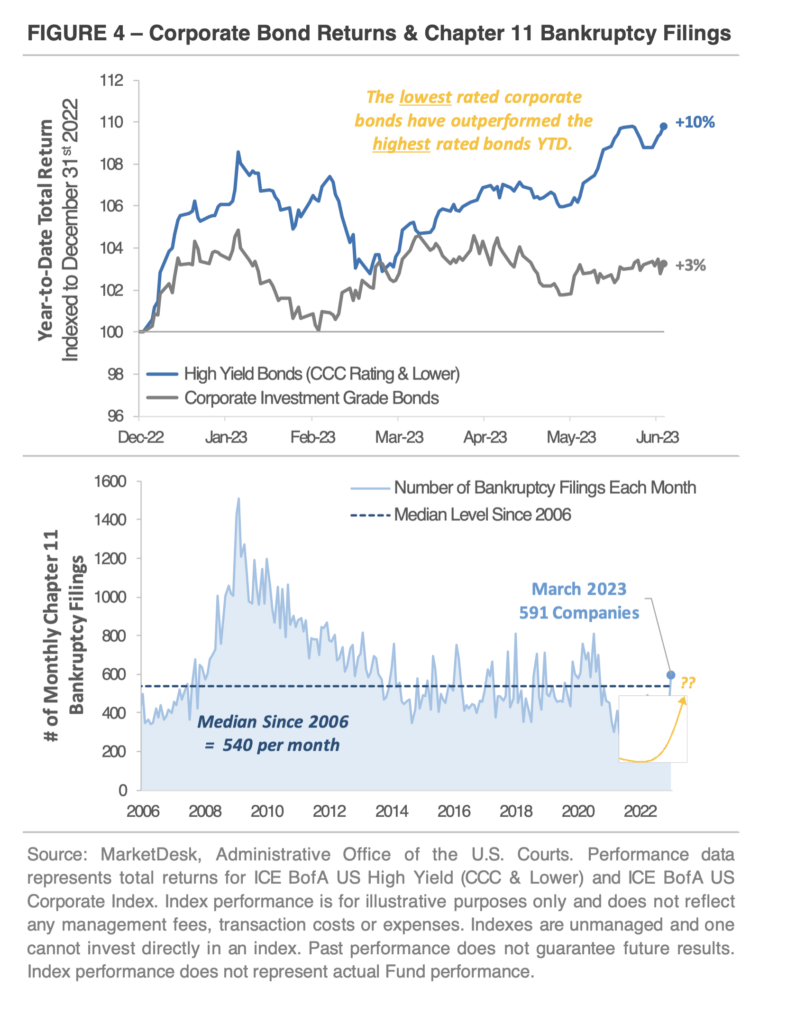
The return gap is striking considering another credit market theme this year – rising bankruptcy filings. The bottom chart in Figure 4 graphs the monthly number of Chapter 11 bankruptcy filings since 2006. It shows the surge in bankruptcies during the 2008 financial crisis followed by the long tail of bankruptcies through 2013. The number of bankruptcy filings stabilized in 2014 and trended sideways through 2019. While there was a brief spike in 2020, the number of bankruptcy filings was below-average in 2021 and 2022. Why did bankruptcy filings decline during the pandemic? Companies benefitted from multiple themes, including low interest rates, fiscal stimulus, and loose bank lending standards. Those themes made financing plentiful and allowed even highly leveraged companies to refinance their old debt and take out new debt. Separately, rising inflation increased companies’ pricing power and drove strong sales growth, which in turn lead to higher profit margins.
The far right of the chart shows the tide is turning. The number of bankruptcy filings in March 2023 crossed above the 20-year median for the first time since December 2020, coming back in line with the pre-pandemic trend. What’s driving the increase? Several themes are contributing to the sharp rise in bankruptcies, including higher interest rates, tighter bank lending standards, and easing inflation. In summary, higher interest rates and tighter bank lending standards are increasing companies’ financing costs at the same time inflation is easing and companies are starting to lose pricing power. High yield bonds offer more income near-term, but that income is tied to credit risk. If the number of bankruptcy filings continues to increase, the losses from those defaults could more than offset the extra income investors earn near-term.
Third Quarter Outlook – Can the Good Times Continue?
The first half of 2023 was marked by continued economic resilience and a rebound in the equity market. The U.S. economy outperformed expectations despite the Fed’s aggressive 2022 rate hikes, with new home sales rising, personal income growing, and continued job creation. Corporate earnings exceeded expectations, and the S&P 500 gained more than 15%. In the credit market, the riskiest corporate bonds outperformed as investors collected higher yields.
As the market enters the second half of 2023, investors are left asking whether the good times can continue. The LEI indicates the U.S. economy may be nearing a turning point, and the economic data may start to show the cumulative effect of the Fed’s interest rate hikes. Plus, there is the potential for additional rate hikes in Q3. While the S&P 500 rally was impressive, it was also top-heavy, with larger stocks driving a significant portion of the gains. Corporate earnings are forecasted to decline, and bankruptcy filings could rise further if borrowers struggle to refinance and/or profit margins decline.
While the first half of 2023 was relatively calm, the economy and market face potential challenges in the second half of the year. Our team will continue monitoring conditions as they evolve and will be prepared to adapt portfolios if needed as the second half plays out.
Important Disclosures: This information is for informational purposes only and should not be construed as investment advice. Investors should consult with their investment advisor to determine the appropriate investment strategy for their individual situation. See ifrahfinancial.com/disclosures for additional information and disclosures.